Construction Analytics Software
Turn project data into clear decisions.
Take all the data that lives in separate tools, and transform it into visual dashboards for construction project reporting—powered by Kahua Analytics.
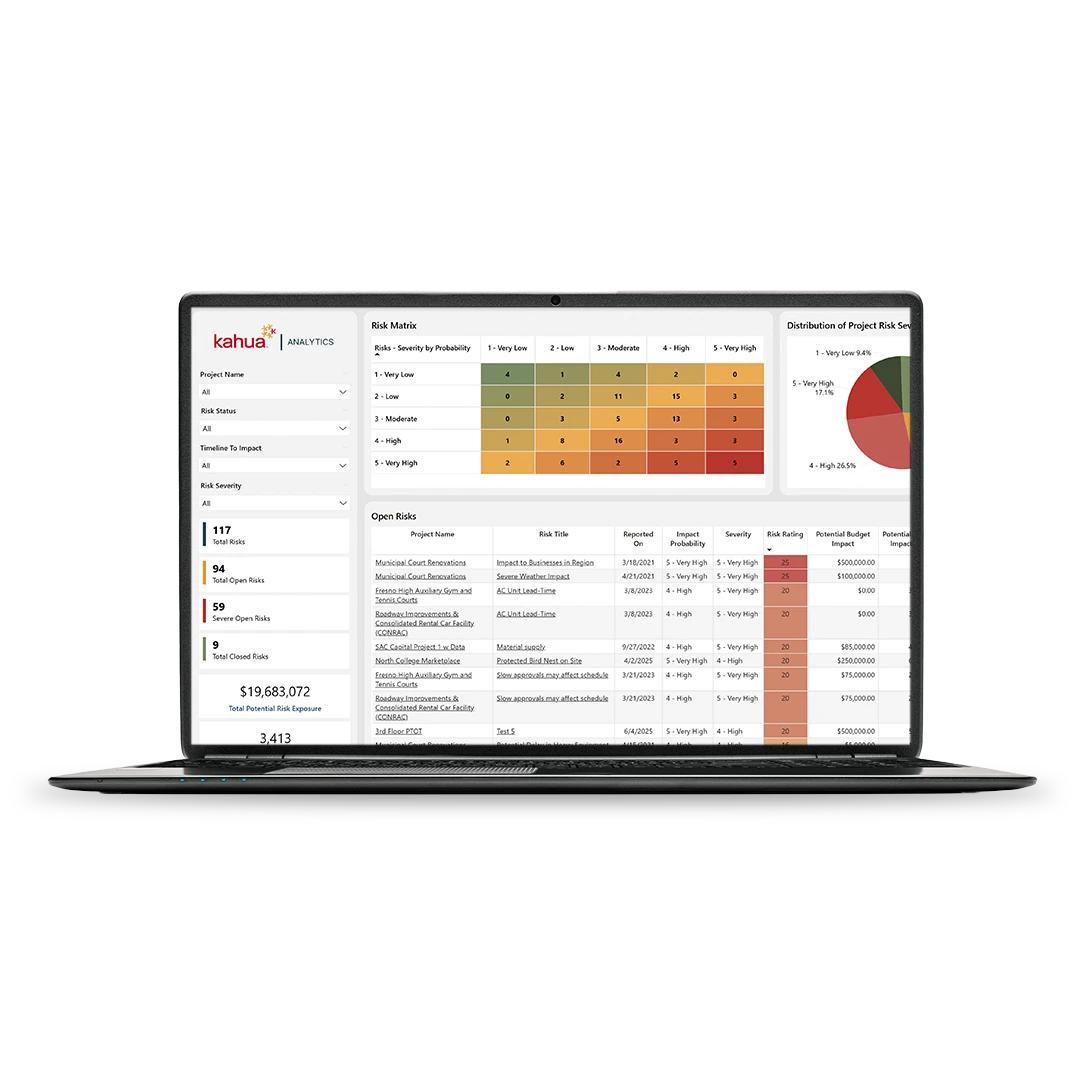
Consolidate scattered data into a single reporting view.
Get a holistic view of project portfolios health, financials, milestones, risks, and approvals, for smarter decision-making with Kahua Analytics construction analytics software.
Configure dashboards to fit team needs.
Filter data in multiple ways with interactive dashboards that provide high-level insights, drill-down views, and granular reporting.
Mitigate and manage risks.
Identify project risks, assess severity, connect cost and schedule impacts, and evaluate mitigation plans before issues grow.
Integrate data between systems.
Bring third-party data into Kahua Analytics through Kahua-centric integrations and data migrations, so reporting reflects a fuller project view.
Dashboards and Analytics
Take full advantage of all your data with Kahua Analytics.
Integrations
Keep your systems fully connected.












Customer Testimonials
Upgrade from manual reporting with Kahua Analytics.
FAQs
Frequently asked questions
Learn how Kahua Analytics helps teams turn project data into dashboards for portfolio views, financials, project health, workflows, risk, and reporting.
Construction analytics software helps teams turn project data into reports, dashboards, and portfolio views. Kahua Analytics helps teams incorporate data from multiple sources—including external third parties—to see project health, financials, workflows, RFIs, approvals, risk registers, and other records from the work happening across projects and programs.
Kahua Analytics is the reporting and dashboard solution for project and program data in Kahua. Teams can use it to review portfolio performance, project health, financials, workflows, RFIs, risk registers, approvals, and other records in one reporting environment.
Kahua Analytics includes pre-built dashboards with industry-specific data points. For healthcare, for example, dashboards include executive dashboards, risk register dashboards, approvals dashboards, bid management dashboards, project health views, financial views, and workflow reporting.
Yes, Kahua Analytics supports a crawl-walk-run approach to construction dashboards. Teams can start with preconfigured dashboards that are specific to each industry, developed using Kahua’s deep experience working with other customers in that industry. For complex programs with very unique needs, customers can work with Kahua’s data science team to build custom dashboards as reporting needs mature.
Yes, data living in other external software can be brought into Kahua Analytics through Kahua integrations and open APIs. Analytics is designed to visualize data stored in Kahua, using the platform’s hierarchical, relational data structure. Popular integrations include ERP (Sage, Trimble Vista and Spectrum, Workday); asset-management software like Nuvolo; estimating solutions (BusinessPlus, Facebook Buy, SAP); document management solutions (DocuSign, EASi); BIM integrations (Autodesk, Bluebeam, Hilti Fieldwire); scheduling integrations (Microsoft Project, SAP, Primavera P6); and many more.
Kahua Resources
Explore analytics and dashboard resources.

Explore Related Solutions