Construction Scheduling Software
Connect your schedule to the work, cost, and decisions behind it.
Schedule Manager gives project teams a clear view of what’s next, what’s changed, and what could impact the timeline, so they can coordinate faster, make more informed decisions, and reduce risk.

Give every team a clearer view of the schedule.
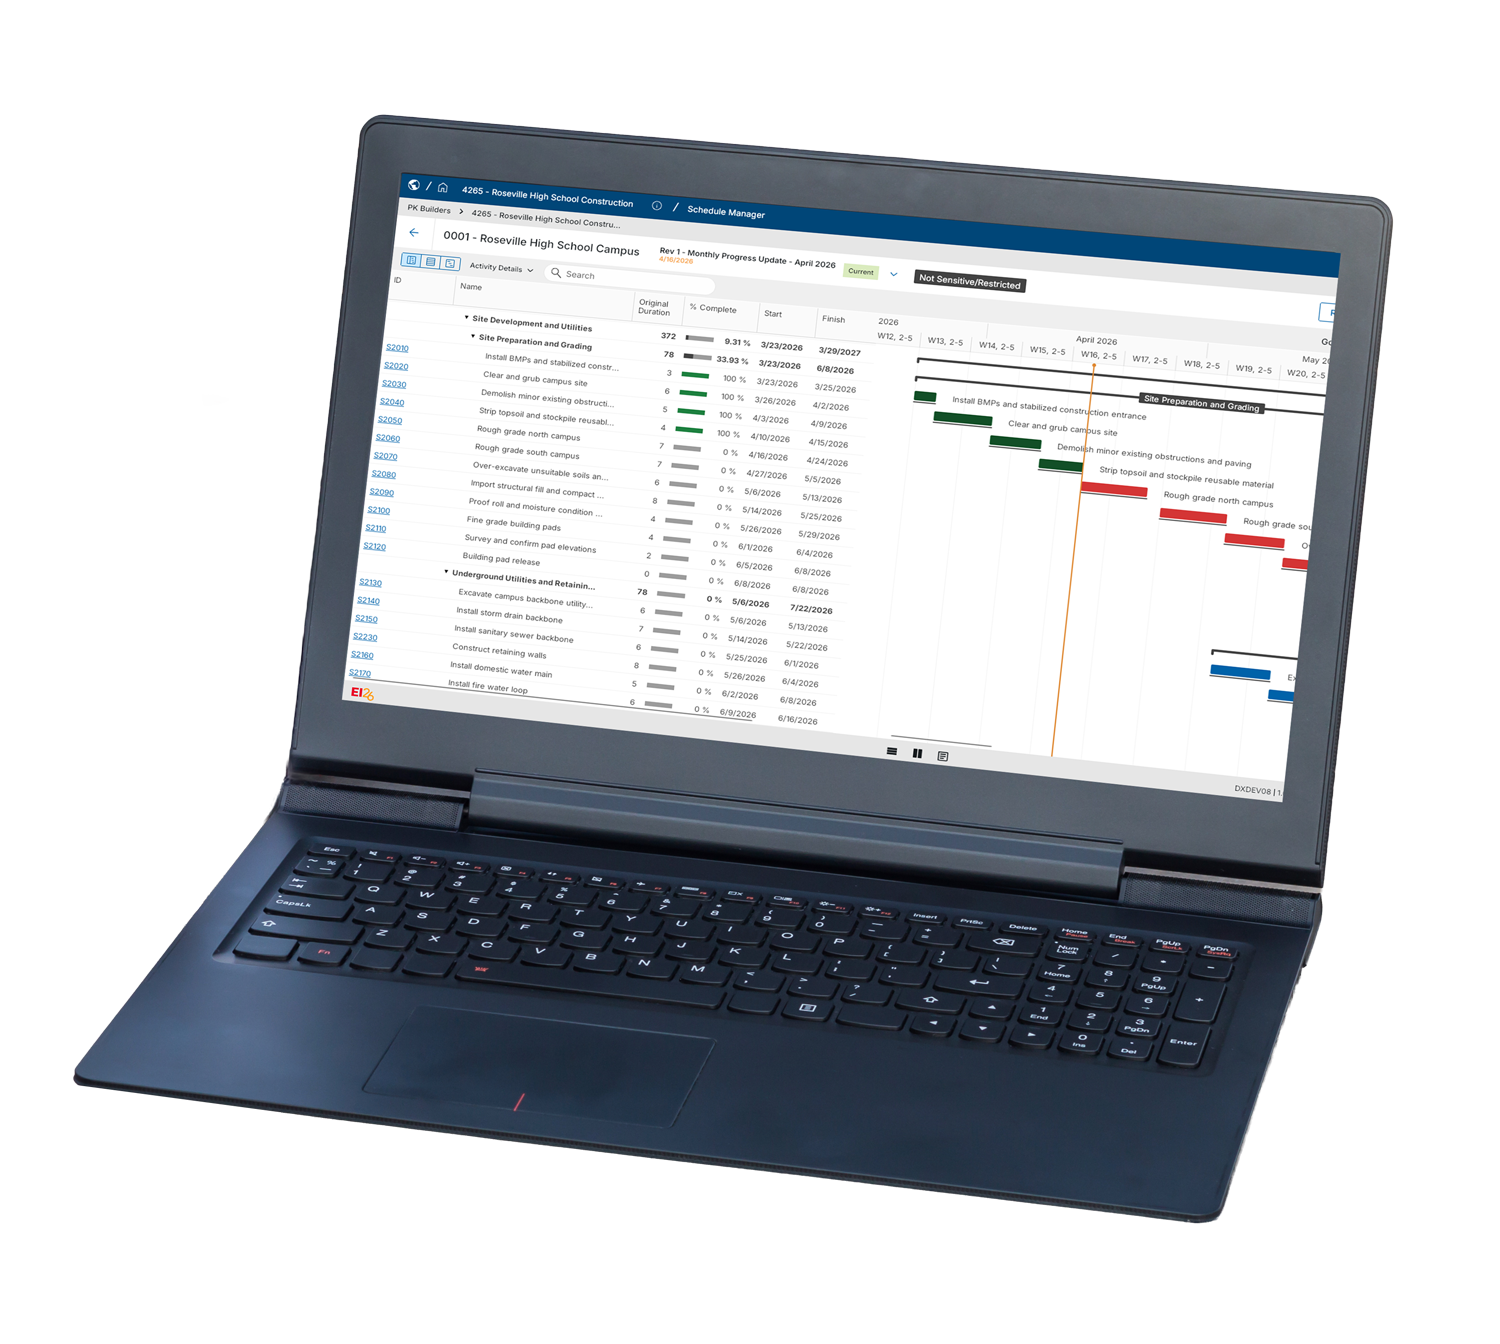
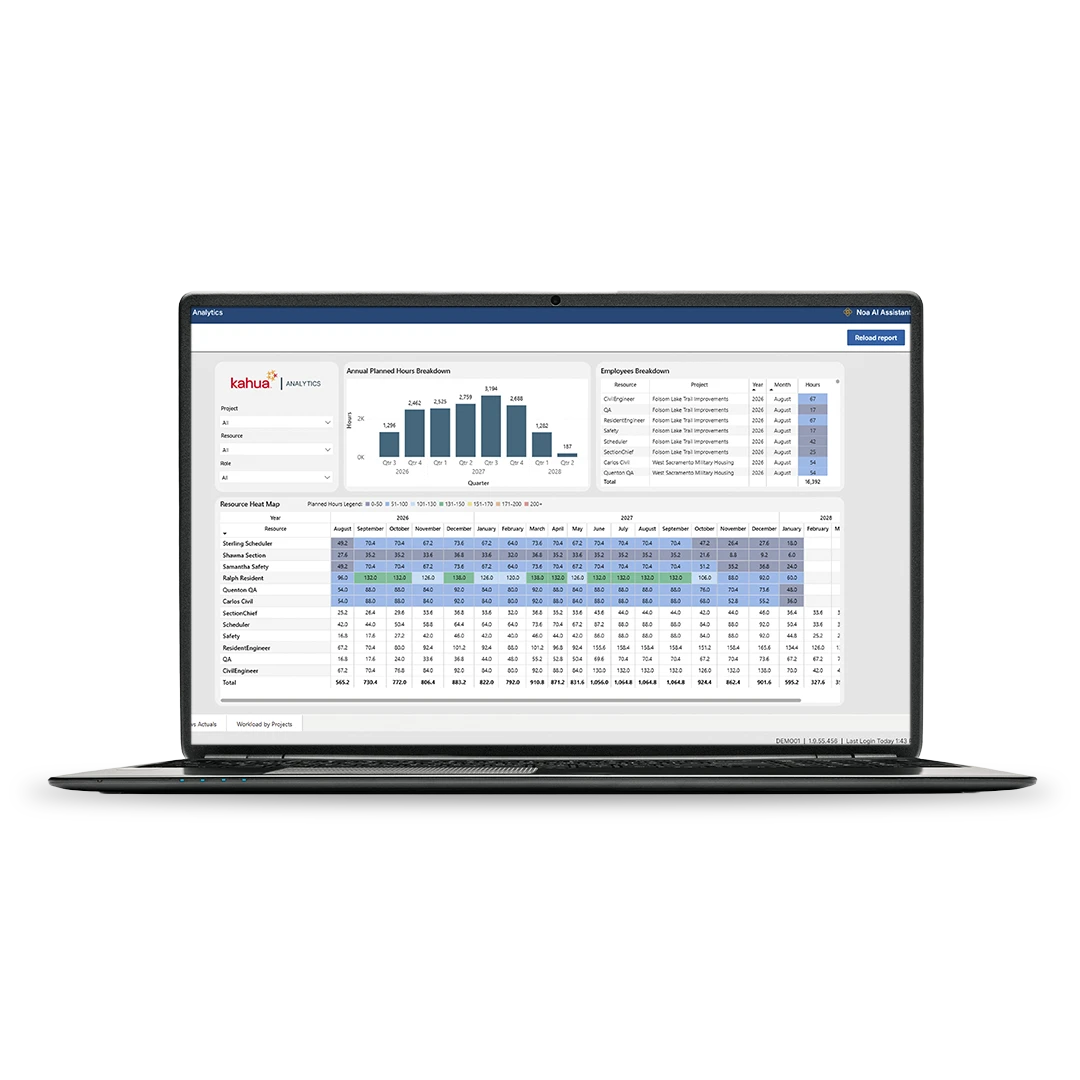
Bring schedules into Kahua with interactive Grid and Gantt views, tailored lookaheads, and visibility into upcoming work.
Connect scheduled work to what’s happening on the project.
Link schedule activities to RFIs, submittals, punch lists, and other project records to see what could impact progress.
See what’s changed and what the impact is.
Compare schedule revisions and baselines to spot shifting dates, track changes, and understand impacts on key milestones.
See schedule risks earlier.
Give teams a clearer view of dependencies, progress, and possible delays, before delays and changes become big risks.
FAQs
Frequently asked questions
Learn how construction schedule management software helps teams plan work, track progress, and keep schedule data connected across large programs.
Construction schedule management is the work of planning what needs to happen, when it needs to happen, and what resources are needed to keep the project moving. For large construction programs, that goes beyond a single project timeline. Teams need to understand how milestones, dependencies, and schedule updates affect the broader program.
The best construction scheduling software for large programs should help teams see schedule information across more than one project. Owners and program teams often need a way to bring schedule data together, understand where progress is slipping, and report clearly to leadership. It should also work with the scheduling tools teams already use.
Primavera P6 is often used to build and maintain detailed construction schedules. Kahua Scheduling helps bring schedule data into the broader project record, where it can be reviewed alongside progress, earned value, cost, milestones, and reporting. For many owner-led teams, the answer isn’t one or the other. Kahua integrates with P6 to make schedule data more useful for program-level visibility and decision-making.
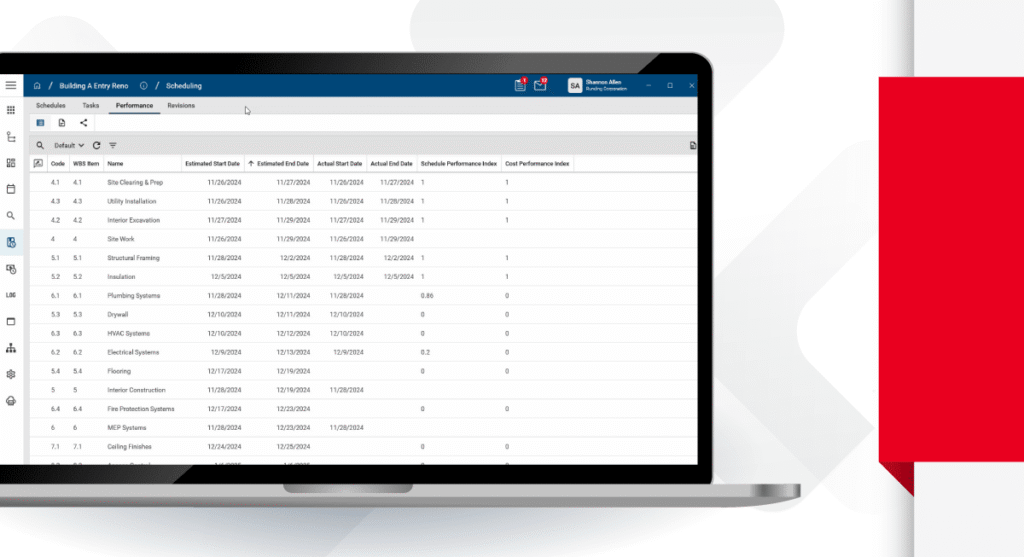
Kahua helps teams import and consolidate schedule data from tools like Microsoft Project and Primavera P6. Once that data is in Kahua, project and program teams can review timelines, monitor milestones, track dependencies, and connect schedule progress to earned value and other project information.
Kahua Resources
Explore construction scheduling resources.


Related Solutions