Construction Cashflow Management Software
See future cash needs before they hit the budget.
Kahua’s construction cashflow management software connects budgets, actuals, commitments, and forecasting. Plan cash needs before spending shifts.
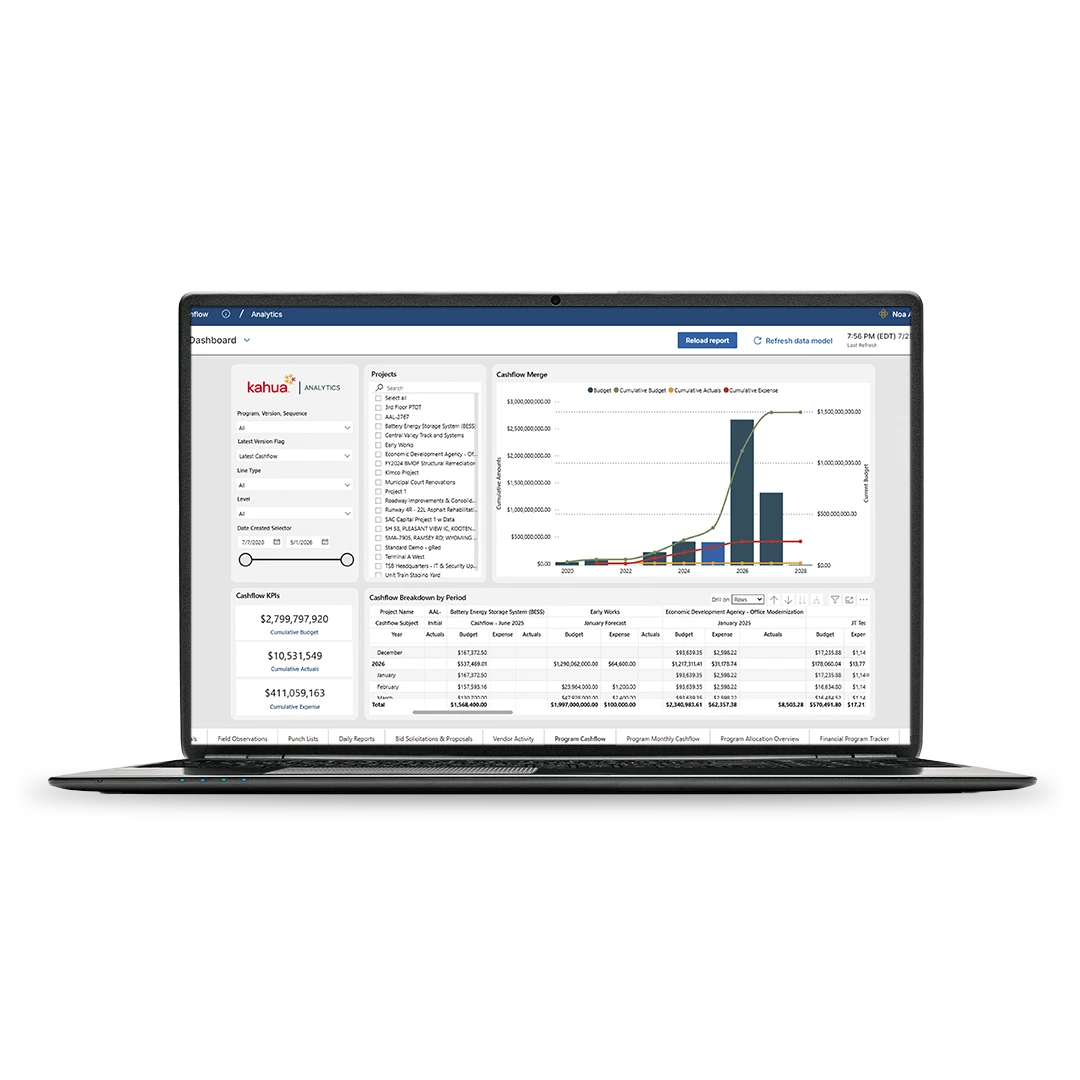
Build from approved budget data
Use budgeted resources, commitments, and actuals as the starting point for cashflow forecasts instead of rebuilding the plan in a separate spreadsheet.
Forecast spend with flexible curves
Use predefined or custom consumption curves to forecast spend by project, program, region, phase, project type, or work breakdown level.
Compare forecasts against actuals
Create multiple cashflow versions, compare them to current plans, and update actuals, pay requests, and financial progress as costs come in.
Connect cashflow to reporting
Give program leaders and finance teams a clearer view of future cash needs across active work, not just historical costs.
Cashflow in Kahua
See budgets and cashflow workflows in action.
Customer Testimonials
Kahua keeps budgets and cashflow connected.
FAQs
Frequently asked questions
Learn how Kahua helps teams connect budgets, commitments, actuals, and forecasts, so cashflow planning stays tied to the project record.
Construction cashflow management software helps teams forecast when project funds will be needed, compare planned spending against actual costs, and see how commitments, changes, and pay requests affect future cash requirements. In Kahua, cashflow planning stays connected to the budget and project record.
Using either predefined or customizable consumption curves, Kahua can forecast cashflow from budget and actuals data. Teams can then create forecasts by project, program, region, phase, project type, or work breakdown level, based on plans and reporting for future spending.
Kahua supports multiple cashflow versions, so teams can compare earlier forecasts against the current plan. As actual costs come in, they can update the forecast and see where spending is staying on track or becoming unbalanced.
Cashflow forecasting connects to cost management by using budgets, commitments, actuals, and pay requests as part of the forecast record. That helps teams move from a static budget view to a forward-looking picture of when money is expected to go out.
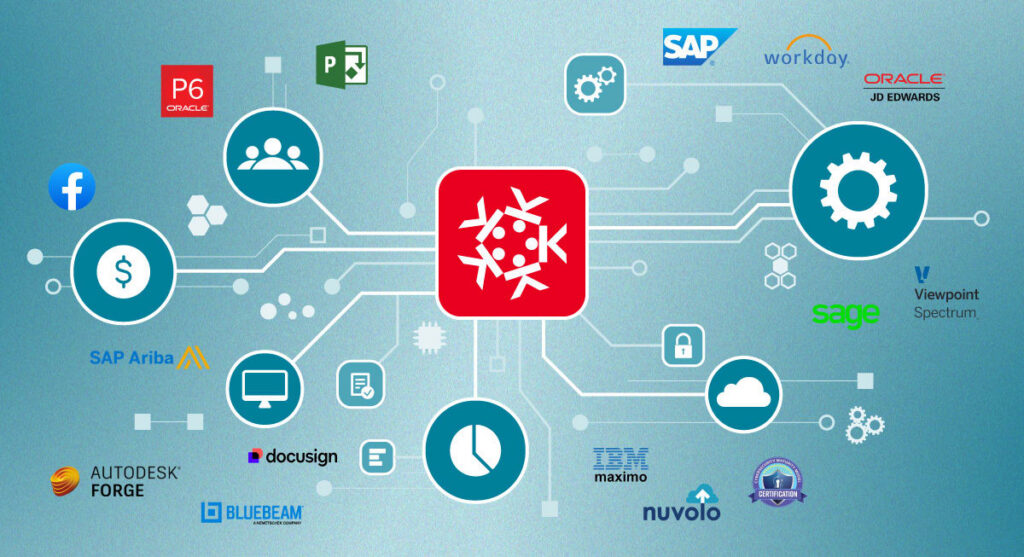
Yes. Kahua is designed to connect project cost data with ERP, finance, scheduling, analytics, and reporting systems. Rather than replacing the accounting system, Kahua makes it easy to build or access out-of-the-box integrations for the systems finance and leadership already use, like Sage, Oracle, SAP, NetSuite, Microsoft Power BI, Tableau, and Primavera P6.
Kahua Resources
Explore resources for cost and cashflow management.



Explore Related Solutions